
HARRISBURG, Pa. — The Department of Health confirmed 980 new Coronavirus cases have been reported, bringing the statewide total to 65,392. The death toll is currently 4,869.
There are 303,514 patients who have tested negative. With commercial labs being the primary testing option for most Pennsylvanians, data is not available on the total number of tests pending.
New Statewide Positive Cases Last 7 Days
5/21/20 — 980
5/20/20 — 746
5/19/20 — 610
5/18/20 — 822
5/17/20 — 623
5/16/20 — 989
5/15/20 — 986
LOCAL REGION
| County | Previous Total | New Cases | Total Cases | Total Deaths |
|---|---|---|---|---|
| Armstrong | 58 | 0 | 58 | 2 |
| Butler | 208 | 1 | 209 | 12 |
| Clarion | 25 | 0 | 25 | 2 |
| Clearfield | 33 | 0 | 33 | 0 |
| Crawford | 21 | 0 | 21 | 0 |
| Elk | 6 | 0 | 6 | 0 |
| Forest | 7 | 0 | 7 | 0 |
| Indiana | 86 | 2 | 88 | 4 |
| Jefferson | 7 | 0 | 7 | 0 |
| McKean | 11 | 0 | 11 | 1 |
| Mercer | 96 | 1 | 97 | 4 |
| Venango | 8 | 0 | 8 | 0 |
| Warren | 2 | 1 | 3 | 0 |
COVID-19 Data for Pennsylvania*
* Map, tables, case counts and deaths last updated at 6:30 p.m. on 5/20/2020
Source: Pennsylvania National Electronic Disease Surveillance System (PA-NEDSS) as of 12:00 a.m. on 5/20/2020
Case Counts, Deaths, and Negatives
| Total Cases* | Deaths | Negative |
| 65,392 | 4,869 | 303,514 |
* Total case counts include confirmed and probable cases.
Hospital Data
- View hospital data (desktop version)
- View hospital data (mobile version)
Trajectory Animations
Positive Cases by Age Range to Date
| Age Range | Percent of Cases* |
| 0-4 | < 1% |
| 5-12 | < 1% |
| 13-18 | 2% |
| 19-24 | 6% |
| 25-49 | 37% |
| 50-64 | 26% |
| 65+ | 29% |
* Percentages may not total 100% due to rounding
Hospitalization Rates by Age Range to Date
| Age Range | Percent of Cases |
| 0-29 | 2% |
| 30-49 | 5% |
| 50-64 | 10% |
| 65-79 | 20% |
| 80+ | 19% |
Death Data
* This information has been extracted from death records registered with the Department’s Vital Records Program as of 11:59 pm on May 19, 2020.
COVID-19 Deaths Registered : 4767
Deaths Per County of Residency
Fifty-three (53) counties have reported COVID-19 deaths
| County | # of Deaths | County Population | Death Rate Per 100,000 Residents |
| Adams | 5 | 102,811 | 4.9 |
| Allegheny | 148 | 1,218,452 | 12.1 |
| Armstrong | 2 | 65,263 | 3.1 |
| Beaver | 71 | 164,742 | 43.1 |
| Bedford | 2 | 48,176 | 4.2 |
| Berks | 279 | 420,152 | 66.4 |
| Blair | 1 | 122,492 | 0.8 |
| Bradford | 3 | 60,833 | 4.9 |
| Bucks | 442 | 628,195 | 70.4 |
| Butler | 12 | 187,888 | 6.4 |
| Cambria | 2 | 131,730 | 1.5 |
| Carbon | 22 | 64,227 | 34.3 |
| Centre | 5 | 162,805 | 3.1 |
| Chester | 238 | 522,046 | 45.6 |
| Clarion | 2 | 38,779 | 5.2 |
| Columbia | 29 | 65,456 | 44.3 |
| Cumberland | 43 | 251,423 | 17.1 |
| Dauphin | 52 | 277,097 | 18.8 |
| Delaware | 481 | 564,751 | 85.2 |
| Erie | 4 | 272,061 | 1.5 |
| Fayette | 4 | 130,441 | 3.1 |
| Franklin | 28 | 154,835 | 18.1 |
| Fulton | 1 | 14,523 | 6.9 |
| Huntingdon | 1 | 45,168 | 2.2 |
| Indiana | 4 | 84,501 | 4.7 |
| Juniata | 3 | 24,704 | 12.1 |
| Lackawanna | 137 | 210,793 | 65 |
| Lancaster | 269 | 543,557 | 49.5 |
| Lawrence | 8 | 86,184 | 9.3 |
| Lebanon | 24 | 141,314 | 17 |
| Lehigh | 192 | 368,100 | 52.2 |
| Luzerne | 130 | 317,646 | 40.9 |
| Lycoming | 10 | 113,664 | 8.8 |
| Mckean | 1 | 40,968 | 2.4 |
| Mercer | 4 | 110,683 | 3.6 |
| Mifflin | 1 | 46,222 | 2.2 |
| Monroe | 95 | 169,507 | 56 |
| Montgomery | 607 | 828,604 | 73.3 |
| Northampton | 186 | 304,807 | 61 |
| Northumberland | 2 | 91,083 | 2.2 |
| Perry | 1 | 46,139 | 2.2 |
| Philadelphia | 1178 | 1,584,138 | 74.4 |
| Pike | 18 | 55,933 | 32.2 |
| Schuylkill | 25 | 142,067 | 17.6 |
| Snyder | 1 | 40,540 | 2.5 |
| Susquehanna | 15 | 40,589 | 37 |
| Tioga | 2 | 40,763 | 4.9 |
| Union | 1 | 44,785 | 2.2 |
| Washington | 5 | 207,346 | 2.4 |
| Wayne | 7 | 51,276 | 13.7 |
| Westmoreland | 38 | 350,611 | 10.8 |
| Wyoming | 7 | 27,046 | 25.9 |
| York | 21 | 448,273 | 4.7 |
* 2018 population data used from the Pennsylvania State Data Center at Penn State Harrisburg.
** Death rate per 100,000 residents.
County Case Counts to Date
| County | Total Cases | Negatives |
| Adams | 204 | 2360 |
| Allegheny | 1718 | 24958 |
| Armstrong | 58 | 1083 |
| Beaver | 539 | 2952 |
| Bedford | 36 | 563 |
| Berks | 3784 | 9407 |
| Blair | 44 | 2138 |
| Bradford | 43 | 1238 |
| Bucks | 4726 | 15691 |
| Butler | 209 | 3248 |
| Cambria | 55 | 2956 |
| Cameron | 2 | 110 |
| Carbon | 221 | 1888 |
| Centre | 136 | 1697 |
| Chester | 2267 | 9558 |
| Clarion | 25 | 608 |
| Clearfield | 33 | 897 |
| Clinton | 48 | 463 |
| Columbia | 342 | 1105 |
| Crawford | 21 | 937 |
| Cumberland | 565 | 3553 |
| Dauphin | 1034 | 8328 |
| Delaware | 5969 | 16546 |
| Elk | 6 | 272 |
| Erie | 177 | 3558 |
| Fayette | 93 | 2728 |
| Forest | 7 | 62 |
| Franklin | 677 | 4426 |
| Fulton | 14 | 182 |
| Greene | 27 | 668 |
| Huntingdon | 221 | 690 |
| Indiana | 88 | 1071 |
| Jefferson | 7 | 443 |
| Juniata | 94 | 290 |
| Lackawanna | 1432 | 4907 |
| Lancaster | 2690 | 12916 |
| Lawrence | 73 | 1083 |
| Lebanon | 887 | 3860 |
| Lehigh | 3586 | 11888 |
| Luzerne | 2594 | 8913 |
| Lycoming | 152 | 1882 |
| McKean | 11 | 447 |
| Mercer | 97 | 1257 |
| Mifflin | 57 | 1059 |
| Monroe | 1291 | 4688 |
| Montgomery | 6268 | 27941 |
| Montour | 51 | 3089 |
| Northampton | 2814 | 10975 |
| Northumberland | 150 | 1179 |
| Perry | 43 | 562 |
| Philadelphia | 16840 | 46470 |
| Pike | 473 | 1770 |
| Potter | 4 | 123 |
| Schuylkill | 548 | 3769 |
| Snyder | 33 | 331 |
| Somerset | 37 | 1414 |
| Sullivan | 2 | 78 |
| Susquehanna | 90 | 566 |
| Tioga | 16 | 461 |
| Union | 61 | 877 |
| Venango | 8 | 417 |
| Warren | 3 | 294 |
| Washington | 130 | 3560 |
| Wayne | 112 | 798 |
| Westmoreland | 434 | 7780 |
| Wyoming | 32 | 372 |
| York | 883 | 11114 |
Incidence by County
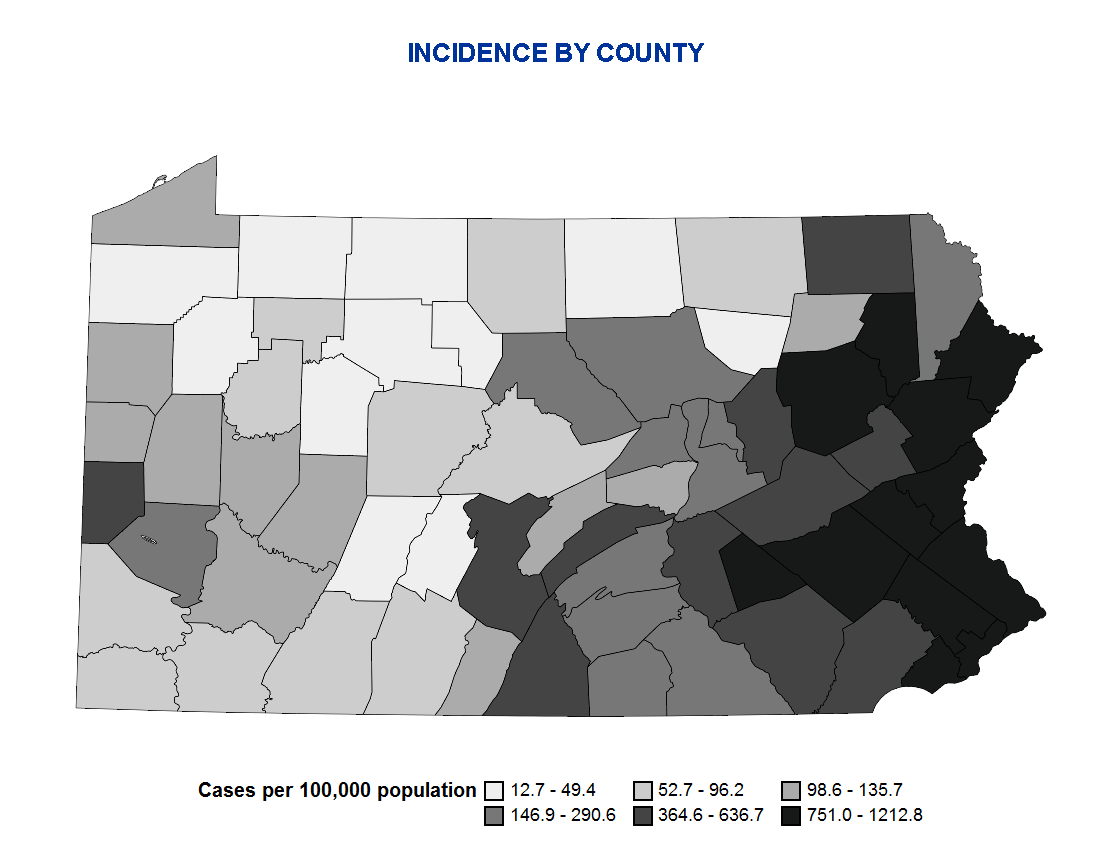
Incidence is calculated by dividing the current number of confirmed and probable COVID-19 cases reported to the Department by the 2018 county population data available from the Bureau of Health Statistics. The counties are divided into 6 relatively equally-sized groups based on their incidence rate (i.e. sestiles). Cases are determined using a national COVID-19 case definition. There currently is no way to estimate the true number of infected persons. Incidence rates are based on the number of known cases, not the number of true infected persons.
Case Counts by Sex to Date
| Sex | Positive Cases | Percent of Cases* |
| Female | 35,909 | 55% |
| Male | 28,799 | 44% |
| Neither | 3 | 0% |
| Not reported | 681 | 1% |
* Percentages may not total 100% due to rounding
Case Counts by Race to Date*
| Race | Positive Cases | Percent of Cases** |
| African American/Black | 7795 | 12% |
| Asian | 868 | 1% |
| White | 17,102 | 26% |
| Other | 356 | 1% |
| Not reported | 39,271 | 60% |
* 60% of ra
Recent Articles


Community Partner


